Monitor
Dashboard · Infrastructure
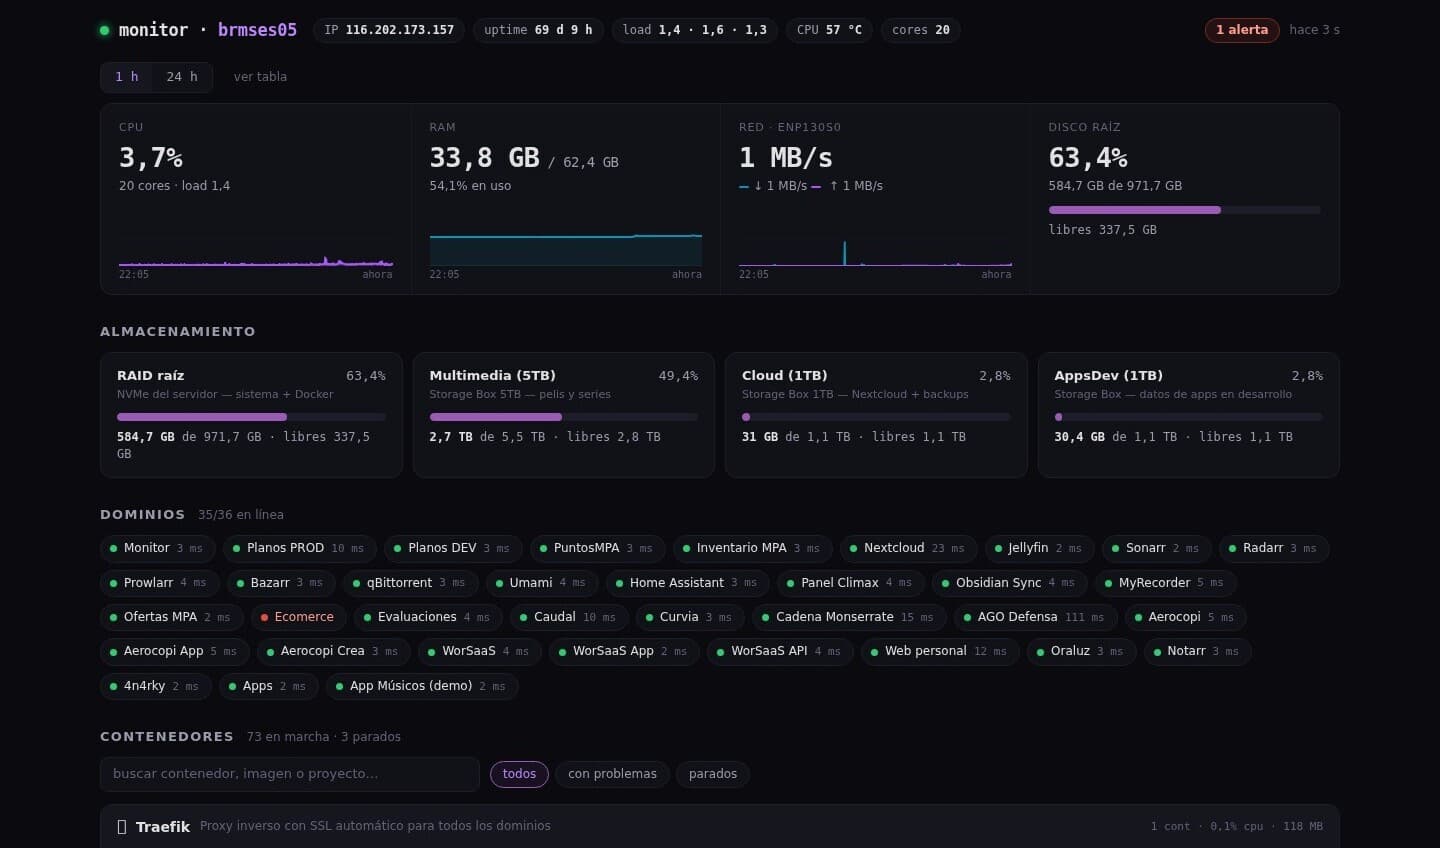
Server monitoring panel written from scratch without a single npm dependency: 72 containers, 36 domains and 3 storage boxes watched in real time.
About the project
A homegrown alternative to Grafana/Netdata watching a full dedicated server: host metrics with sparklines (CPU, RAM, network, disk, temperature), 72 Docker containers grouped by project, HTTPS health of 36 domains with certificate expiry and CIFS mounts verified via statfs. The key design decision: zero dependencies — the backend is pure Node 20 (~570 lines) and the frontend vanilla JS. Docker access goes through a read-only socket proxy: the panel can never touch a container. Its guiding principle: a green panel with stale data is the worst possible failure, so if the data source stops responding, it says so loudly.
Tech stack
Key features
- Node backend with zero external dependencies: collector, API and static server in ~570 lines
- CPU/RAM/network/disk/temperature sparklines with 1h@5s and 24h@2min in-RAM series
- 72 containers watched via a read-only socket proxy — the panel can never touch containers
- HTTPS health of 36 domains: latency and days until certificate expiry
- Unmounted CIFS storage detected via statfs magic numbers
- Derived alerts: unhealthy, crash-loop, full disk, expiring certificates
- Critical 'frozen data' alert if the Docker API stops responding
- Declarative catalog: adding a project or domain is editing one JSON
Technical challenges
Reading host metrics from an isolated container: PID 1's /proc for network and statfs for disks
Surviving hung CIFS mounts without freezing the sampling loop: timeouts and a widened thread pool
Never letting a collector failure look like a healthy server: explicit frozen-data alerts
Want something similar for your business?
Get a quote